
Global e-waste statistics (Top Picks)
- Annual e-waste generation: The world generated 53.6 Mt of e-waste in 2019. That’s an average of 7.3 kg per capita. The amount of e-waste generated is expected to grow at about 3.5% per year and will reach 74.7 Mt by 2030. (2)
- E-waste recycling rate: In 2019 only 17.4% of the e-waste was collected and recycled. At the moment, the recycling activities are not keeping pace with the global growth of e-waste. (2)
- Value of the e-waste: The value of raw materials in the e-waste generated in 2019 was roughly USD 57 billion with only USD 10 billion recovered in an environmentally accepted way. Based on the Global e-waste monitor, gold, silver and palladium alone represent about USD 13.5 billion in value. (2)
- E-waste compared to the total waste: The world generates about 2 billion tonnes of waste annually of which 53.6 Mt in 2019 was e-waste. This means that e-waste represents about 2.7% of the total waste produced globally. (2)
- E-waste is not the best waste for a landfill: Plastic in the e-waste can take up to 1 million years to decompose, while aluminum and other metals can take anywhere between 50 and 500 years to break down. Some components in the e-waste will pollute the environment rather than biodegrade. (3)
- Mobile phones are a significant source of e-waste: Based on the Environmental Protection Agency report from 2014, in the US alone about 152 million mobile phones are discarded every year. (14)
- E-waste manufacturing is very resource-hungry: It takes at least 240kg of fossil fuels, 22kg of chemicals, and 1.5 tonnes of water to manufacture a single computer and its screen according to a UN study. This is more than the weight of a car. (15)
- E-waste represents a significant opportunity for circular economies: In 2019 seven UN entities released a report stating that annual e-waste production is worth over USD 62 billion annually. With only about 17% of e-waste recycled today, precious metals represent a significant value currently locked in the accumulated millions of tonnes of electronic waste. (16)
What is e-waste?
E-waste, also known as electronic waste, refers to discarded electrical or electronic devices. E-waste typically includes items such as computers, cell phones, televisions, and other electronic equipment that have reached the end of their useful life. Because many of these items contain materials that are hazardous to the environment and human health, it is important to properly dispose of e-waste to prevent it from polluting the air, water, and soil.
What are the types of e-waste?
There is a total of 54 EEE (Electrical and Electronic Equipment) product categories that are grouped into 6 general categories depending on their waste management characteristics:
- Temperature exchange equipment. This typically includes freezers, heaters, air conditioners, heat pumps, dehumidifiers, and so on.
- Screens and monitors. Includes televisions, laptops, tablets, e-book readers, and other screens. Important to note that this category doesn’t include phone screens as they are considered to be too small.
- Typically includes fluorescent lamps, LED bulbs and lamps, and high-intensity discharge lamps. Light fixtures are excluded from this category.
- Large equipment. Typically, equipment that has at least one external dimension greater than 50cm. This includes large household items like washing machines, driers, stoves, large printing machines, photovoltaic panels, or large medical equipment.
- Small equipment. This category includes items that don’t fit into other categories with all external dimensions less than 50cm. Typically equipment includes vacuum cleaners, microwaves, toasters, electric kettles, video cameras, radio sets, electrical tools, small medical devices, monitoring equipment, and other kitchen and consumer electronic equipment.
- Small IT and Telecommunication equipment. Includes electronic equipment that didn’t make other categories, has all external dimensions less than 50cm, and is used for IT or communication. This includes mobile phones, personal computers, printers, GPS devices, routers and modems, and other similar devices.
Which metals are found in e-waste?
EEE may contain up to 69 elements from the periodic table including precious metals like gold, silver, platinum, palladium, and many others. A large part of the e-waste is critical raw metals like cobalt, indium, germanium, bismuth, and antimony, as well as non-critical metals like aluminum and iron.
For example, the concentration of gold in mobile phones and personal computers can be relatively high, reaching 280 grams per ton of e-waste. (2)
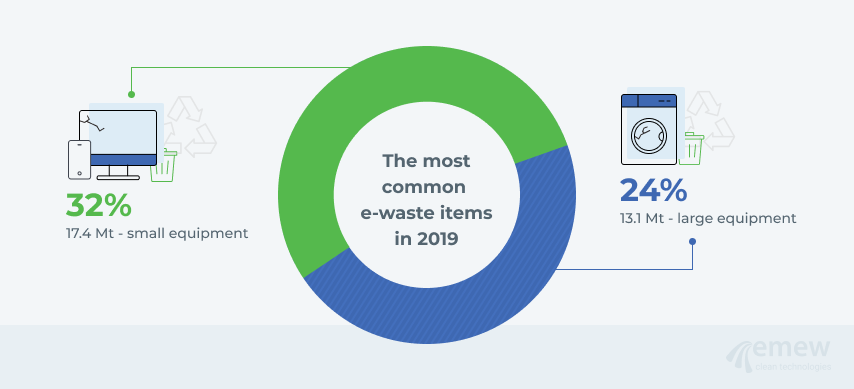
What are the most common e-waste items?
The majority (about 32% or 17.4 Mt) of e-waste generated in 2019 comprised small equipment like vacuum cleaners, microwaves, toasters, electric kettles, video cameras, radio sets, electrical tools, small medical devices, monitoring equipment, and other kitchen and consumer electronic equipment.
The runner-up (about 24% or 13.1 Mt) was e-waste from the large equipment category that includes items like washing machines, driers, stoves, etc. (2)
What percentage of total waste is e-waste?
Currently, e-waste represents about 2.7% of the total waste produced globally.
The world generates about 2 billion tonnes of waste annually out of which 53.6 Mt in 2019 was e-waste. (2,17)
E-waste Regional Overview
Which country generates the most e-waste?
Based on the recent stats, in 2019 China generated 10.1 Mt of e-waste which makes it the biggest contributor of electronic waste in the world. This amounts to about 19% of the total e-waste generated in the world.
The reasons for that are the concentration of EEE manufacturing in the country, as well as the large domestic population which creates a lot of local demand for electronics. (2)
Which region is the largest contributor to e-waste?
In 2019 Asia generated the most e-waste (24.9 Mt), followed by the Americas (13.1 Mt) and Europe (12 Mt).
While in absolute numbers Asia is the biggest e-waste contributor, Europe is ranking first in terms of e-waste generated per capita. (2)
What country has the lowest e-waste generation per capita?
African countries generate the least e-waste. Countries like Burundi, Central African Republic, Guinea-Bissau, Malawi, Mozambique, Niger, and Sierra Leone each generated only 0.5 kg of e-waste per capita in 2019. (2)
Which country recycles the most e-waste?
Based on the statistics available, in 2018 China recycled 1546 kt of e-waste. China put in place legislation enforcing recycling collection and treatment of 14 various types of e-waste.
The country also set targets of sourcing 20% of raw materials for new EEE to come from recycled materials and recycle 50% of electronic waste by 2025. (2)
E-waste trends
Is electronic waste increasing?
The world’s e-waste grew by 9.2 Mt between 2014 and 2019 and is projected to grow to 74.7 Mt by 2030.
With collection and recycling growing only 1.8 Mt between 2014 and 2019 rate at which we generate electronic waste significantly outpaces the recycling rate. (2)
What is e-waste CAGR (Cumulative Annual Growth Rate)?
The growth of e-waste has been a growing concern in recent years, as the demand for electronic devices continues to increase and the lifespans of these products continue to decrease.
According to recent estimates, the market is projected to grow to about USD 145 Billion by 2030 at a CAGR of 13.2%. (7)
Why is e-waste growing so fast?
Factors like economic growth, population increase, rapid urbanization, and as a result increase in demand for consumer electronics are a few of the factors leading to the fast growth of e-waste. Few repair options and the short life cycle of products are also significant contributors to the e-waste generation.
The amount of e-waste the world generates is estimated to grow to 74.7 Mt by 2030 – almost doubling since 2014. (2)
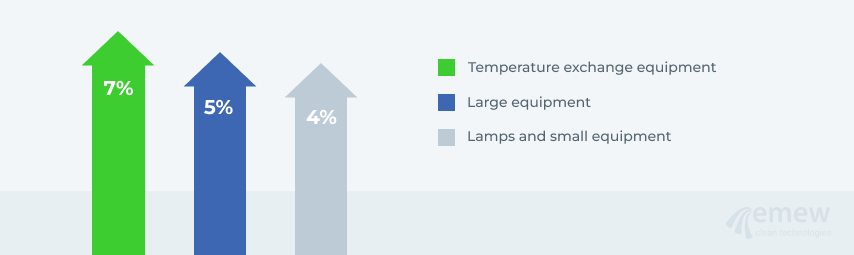
What is the fastest-growing e-waste stream?
Temperature exchange equipment e-waste is growing at the fastest rate (7% per year on average), followed by large equipment (5% per year on average), and lamps and small equipment (4% per year on average).
This growth is attributed to the economic development of lower-income countries and increased consumption of household items. (2)
E-waste and its effects on the Environment
Why is e-waste causing pollution and why is it a huge problem?
Several toxic additives and substances are contained in the e-waste. These include mercury, brominate flame retardants (BFR), chlorofluorocarbons (CFCs), or hydrochlorofluorocarbons. Improper collection and recycling of these materials poses significant risks to human health and the environment. Based on the Global E-waste Report, a total of 50 t of mercury and 71 kt of BFR plastics are found in globally undocumented flows of e-waste annually.
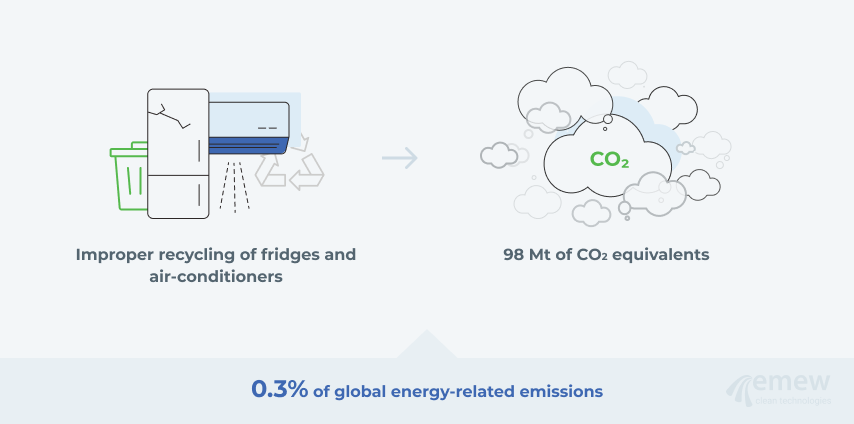
In addition to this, improper handling of e-waste also contributes to the global warming problem. 98 Mt of CO2-equivalents (or 0.3% of global emissions in 2019) were released into the environment because of improperly discarded fridges and air conditioners. (2)
How toxic is e-waste?
Electronic waste contains hazardous substances, usually heavy metals such as mercury, cadmium, or lead, and chemicals such as chlorofluorocarbons (CFCs), hydrochlorofluorocarbons (HCFCs), and flame retardants.
Some of the contaminants in e-waste pose serious health risks and can be responsible for kidney damage, and skin disorders, and affect the nervous and immune systems. (2)
How does e-waste affect global warming?
Improper e-waste management contributes to global warming. Improper recycling of fridges and air-conditioners led to the release of 98 Mt of CO2 equivalents into the environment in 2019 alone.
This accounts for about 0.3% of global energy-related emissions. (2)
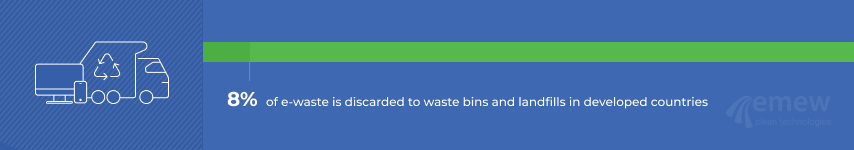
What percentage of e-waste ends up in landfills?
The percentage of e-waste that ends up in landfills varies across the different regions. In countries with developed recycling infrastructure around 8% of the e-waste is discarded in waste bins and landfilled.
In other regions, such as Central Asia, most of the e-waste ends up in landfills or illegal dumping sites. In Eastern Europe recycling industry is in development, but for now doesn’t achieve the same rates of recycling as Northern and Western Europe. (2)
E-waste recycling
Recycling e-waste is important for several reasons. One of the primary reasons is that electronic devices often contain a variety of materials, including metals, plastics, and glass, which can be recovered and used to manufacture new products. This not only reduces the need to extract and process raw materials but also reduces the amount of waste that ends up in landfills.
In addition to the environmental benefits of recycling e-waste, there is also a significant monetary value to be gained from recovering and recycling these materials. For example, the metals in electronic devices can be recovered and sold to metal recyclers, who can then use them to manufacture new products.
Similarly, the plastics and other materials in electronic devices can be recovered and used to make new products, which can generate revenue for recyclers and manufacturers.
Overall, recycling e-waste is important for both environmental and economic reasons. By recovering and recycling materials from electronic devices, we can reduce waste, conserve natural resources, and generate revenue from the sale of recovered materials.
What metals can be recovered from e-waste?
A wide variety of base and precious metals can be recovered from e-waste including:
Ferrous metals: Iron
Base metals: Copper, Tin, Lead, Nickel, Aluminum, Zinc
Precious metals: Iridium, Rhenium, Ruthenium, Rhodium, Palladium, Osmium, Platinum, Silver, and Gold
Rare-earth metals: Neodymium, Europium, Terbium, and other rare earth metals
Many other elements and metals can be found and recycled from e-waste: Lithium, Silicon, Cadmium, Tellurium, Titanium, Molybdenum, and some others.
Why is e-waste recycling so difficult?
There are a few reasons why e-waste recycling is so difficult.
E-waste recycling is very costly. The consumer products are not designed nor assembled with recycling principles in mind which brings complexity to the recycling process.
Recycling of e-waste is a very complicated process from a technical standpoint, requiring multiple steps of shredding, separation of plastic and metals, hydro and/or pyro metallurgical steps for metal recovery, and many other technological know-how.
On the other hand, a large amount of precious and base metals makes it worthwhile to invest in the recycling process design. For example, it is estimated that there are 280 grams of Gold in one ton of mobile phone e-waste. (2)
Technologies for effective e-waste recycling
Several technologies are commonly used for effective e-waste recycling. These include:
- Physical separation techniques: Physical separation techniques are used to separate different materials in e-waste, such as metals, plastics, and glass. These techniques can include shredding, grinding, or crushing the e-waste to make it easier to sort and separate the different materials.
- Pyrometallurgical processes: Uses heat to separate the different materials in e-waste. For example, a technique called smelting uses high temperatures to melt metals, which can then be separated and recovered.
- Chemical separation techniques: Chemical separation techniques use chemical reactions to separate the different materials in e-waste. For example, a common technique called hydrometallurgy uses a solution of water and chemicals to dissolve metals, which can then be electrowon as a high-purity metal cathode.
We prepared a detailed blog on precious metals recovery from e-waste and highly recommend you read it.
The role of e-waste in the circular economy
In a circular economy, e-waste is seen as a valuable resource that can be recovered and recycled. This is because many of the materials used to make electronic devices can be recovered and used again in the production of new products. By recycling e-waste in a circular economy, we can reduce the need for mining and other forms of resource extraction, which can help to conserve the environment and reduce pollution.
Gold
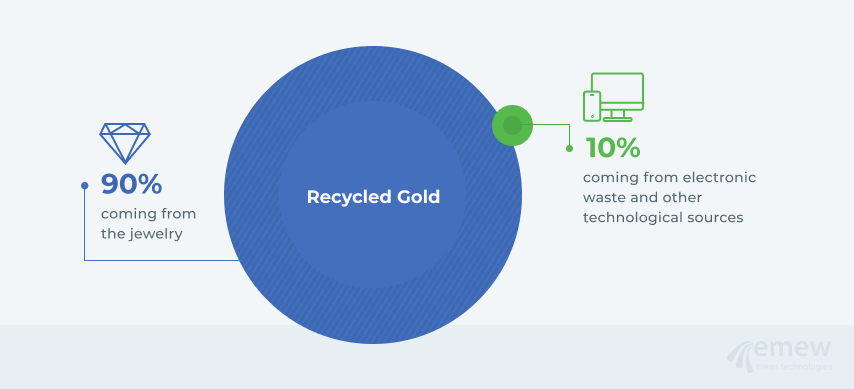
These days gold mostly comes from mines. About 75% of the total supply of gold is mined every year. This is not nearly enough to cover the overall demand of about 4,000 metric tons and the rest is made up from recycling. (8)
About 90% of the recycled gold comes from jewelry with the rest (about 160 metric tons) coming from electronic waste and other technological sources. (6)
Silver
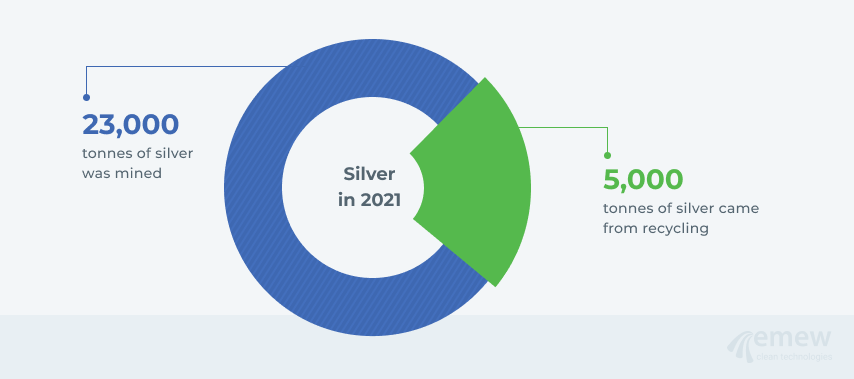
In 2021 about 23,000 tonnes of silver was mined and only about 5,000 tonnes of silver came from recycling. Recycled silver comes from a variety of sources including industrial, jewelry, silverware, and photography. (9) Silver from electronic waste represents about 900 tonnes per year and this number is expected to grow over the course of the next few years.
Copper
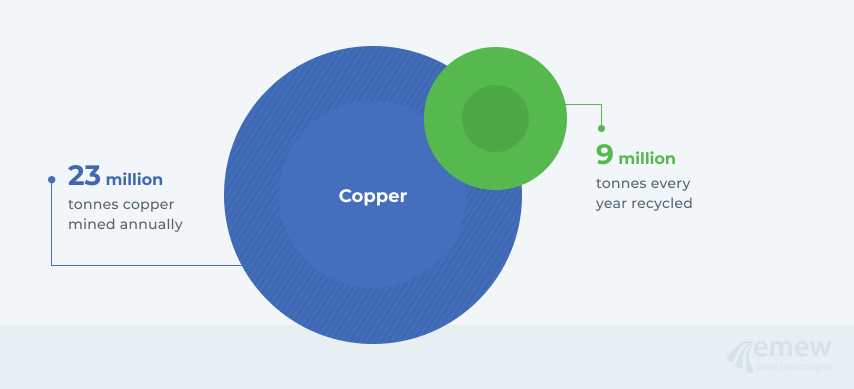
About 23 million tonnes of copper are mined on an annual basis worldwide. Copper is one of the most recycled metals as close to 9 million tonnes every year are recovered from end-of-life scrap and scrap generated during the industrial production processes. On average 32% of all copper in use was sourced through recycling. (10,11)
Palladium
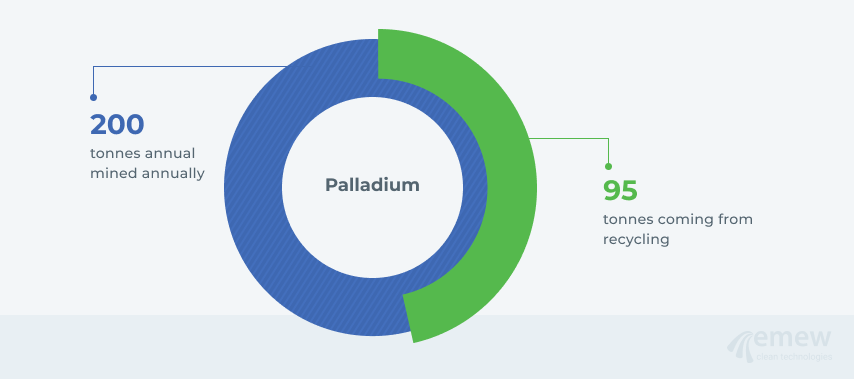
Palladium produced currently is not enough to satisfy the demand, which leads to an increased requirement for recovery from scrap. With about 80% of palladium utilized in auto exhaust systems, recycling of catalytic converters has become very trendy, and recyclers are taking advantage of the deficit. (12)
World mine production yields about 200 tonnes of palladium annually with an additional 95 tonnes coming from recycling, mostly from catalytic converters. (13)
What are the main systems and legislation for e-waste management?
Most of the electronic waste can and should be recycled. E-waste contains materials and metals that can be reused and given a second life.
Some of the ways to increase the recycling rates of e-waste are:
- Establish a clear legal framework for e-waste collection and recycling
- Introduce extended producer responsibility to ensure producers finance the collection and recycling of e-waste
- Enforce legislation for all stakeholders, and strengthen monitoring and compliance mechanisms
- Create favorable investment conditions for experienced recyclers to bring the required technical expertise to the country
- Create awareness of the environmental benefits of recycling among consumers. (Magalini et al. 2016)
Sources:
- https://dosomething.org/article/11-facts-about-e-waste
- Global E-waste Monitor (https://ewastemonitor.info/)
- https://eridirect.com/blog/2015/11/how-long-does-it-take-electronic-waste-to-decompose/
- https://sdg.iisd.org/
- https://www.rohsguide.com/rohs-weee.htm
- https://www.gold.org/gold-supply
- https://www.globenewswire.com/en/news-release/2022/09/26/2522360/0/en/Global-E-waste-Management-Market-Size-to-grow-USD-145-11-Billion-by-2030-CAGR-of-13-2-Spherical-Insights-Consulting.html
- https://www.statista.com/statistics/274684/global-demand-for-gold-by-purpose-quarterly-figures/
- https://www.silverinstitute.org/wp-content/uploads/2022/04/World-Silver-Survey-2022.pdf
- https://www.copper.org/resources/market_data/pdfs/annual-data-book-2021_final.pdf
- https://internationalcopper.org/resource/copper-recycling/
- https://www.mining.com/web/junkyard-palladium-growing-answer-disappearing-resource/
- https://genmining.com/investors/palladium-101/
- https://www.verizon.com/
- https://news.un.org/en/story/2004/03/96452
- https://www.weforum.org/press/2019/01/all-that-flickers-is-gold-the-62-billion-opportunity-of-our-thrown-away-electronics/
- https://www.theworldcounts.com/challenges/planet-earth/state-of-the-planet/world-waste-facts